Inequality and extreme heat
In many US cities, temperatures tend to be substantially higher in areas that have borne the brunt of discriminatory housing policies and practices. The Climate Safe Neighborhoods partnership has mapped the impacts of these policies in Cincinnati, Ohio, and 8 other cities.
Starting in the 1930s, the US government rated neighbourhoods in many cities on the perceived risk level for home loans. Grades were based on several factors, including the races of people living there. The riskiest or lowest grade was marked in red, which gave rise to the term redlining.
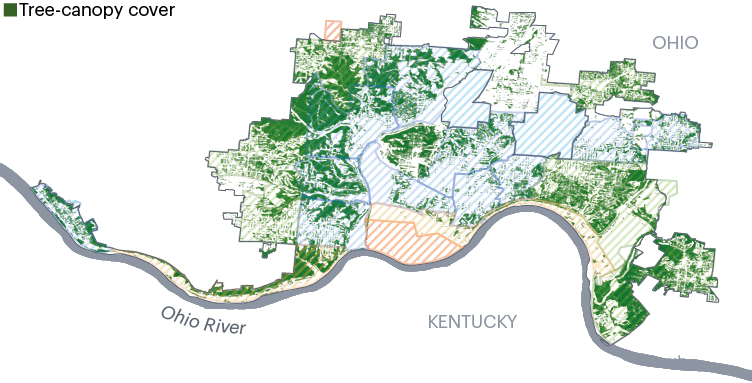
Areas of the city that were most affected by discriminatory housing practices have much less tree cover.
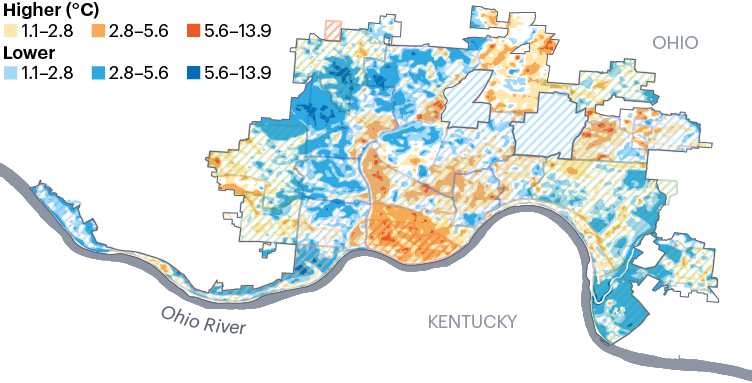
An analysis of data from the Landsat 8 satellite for the summers of 2013–19 shows that some areas have temperatures that are many degrees higher than the average for the mapped zone.
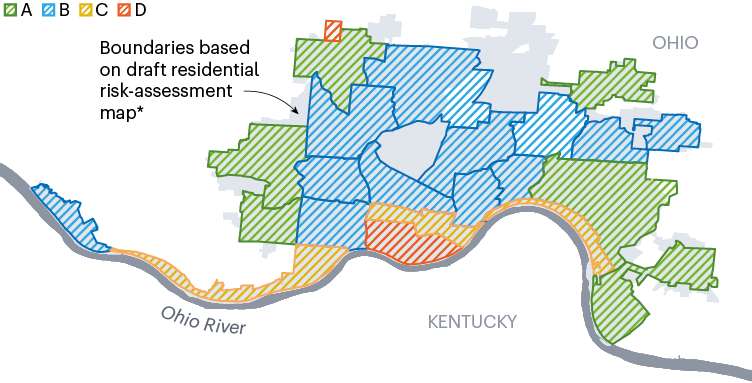
*Researchers have not been able to find the finalized Home Owner's Loan Corporation residential securities map for Cincinnati.
Source: Maps based on data from Climate Safe Neighborhoods, Groundwork Ohio River Valley dashboard, Lawrence Hoffman.