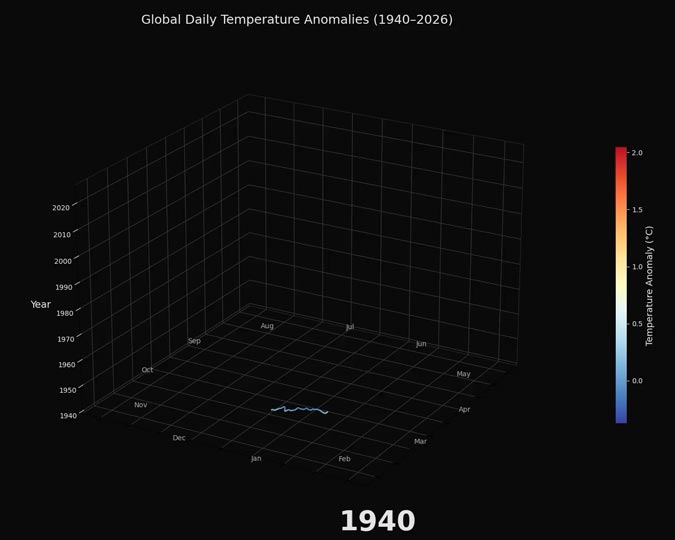
This animation, generated with the help of AI coding tools, shows how daily global mean surface temperature has increased over time. The difference relative to the 1850-1900 average is shown in the color and width of the rings. (This video has no sound.) Here is a link to the video file .